Two New Awards! GSTA and Izaak Walton Killam Memorial Scholarship

Two New Awards! GSTA and Izaak Walton Killam Memorial Scholarship

I’m happy to announce that last month I got awarded the Graduate Student Teaching Award at the University of Alberta! This award is given to “outstanding teaching assistants at the University of Alberta.” Furthermore, I feel deeply honored to also have been awarded the Izaak Walton Killam Memorial Scholarship “the most prestigious graduate award administered by the University of Alberta”, and have joined the Killam Family of Scholars.

Source: V.G. – RSS

New Publication: Monitoring Cognitive Ability in Patients with Moderate Dementia Using a Modified “Whack-a-Mole”

New Publication: Monitoring Cognitive Ability in Patients with Moderate Dementia Using a Modified “Whack-a-Mole”

Venue: International Symposium on Medical Measurements and Applications. IEEE. May 7, 2017. Rochester. USA. – Accepted


This paper is the result of an ongoing collaboration with the Carleton University, the Bruyère Research Institute, and the Elisabeth Bruyère Hospital, in Ottawa, Canada. in which PhyDSL has been used to build mobile games with rehabilitation purposes. 

Abstract: This paper presents results from the first 2 months of a 1-year study of 12 moderate dementia patients that participate in a weekly adult day program within a local community-care access center. The 12 patients are using a tablet-based whack-a-mole game, instrumented to record the user’s behavior; this record is analyzed to extract indicators, as potential proxies of cognitive ability. Our partnership with the adult day program greatly eased recruitment: all but 1 eligible participant joined our study. The measurements recorded by the game include the detailed user progression through the game levels. There are two unique aspects to the design of our game: first, it includes two distinct targets requiring different actions, which increases the cognitive processing in the tap task for the users; second, each level is systematically more difficult than the last.

The results show that the patients’ performance within the game improves over the first few weeks; this indicates that they are learning the game and retaining ability gains from week to week, which is unexpected in dementia patients. Subsequently they appear to reach a performance plateau, with consistent performance from one week to the next. The performance levels are compared to their MMSE Total score and MMSE Orientation for Time subscore and they are shown to have a maximum correlation of 0.465 and 0.654 respectively. These results demonstrate the potential for the whack-a-mole game to provide an ongoing measurement alternative for the MMSE and specifically the Orientation for Time sub-score that is a predictor of future decline.

Authors: Wallace, B., Knoefel, F., Goubran, R., Masson, P., Baker, A., Allard, B., Stroulia, E., Guana, V.
Source: V.G. – RSS

New Publication: End-to-end Model-transformation Comprehension Through Fine-grained Traceability Information

New Publication: End-to-end Model-transformation Comprehension Through Fine-grained Traceability Information
Journal: Information. International Journal on Software and Systems Modeling (SoSYM) – Accepted

Abstract: The construction and maintenance of model-to-model and model-to-text transformations pose numerous challenges to novice and expert developers. A key challenge involves tracing dependency relationships between artifacts of a transformation ecosystem. This is required to assess the impact of metamodel evolution, to determine metamodel coverage, and to debug complex transformation expressions.

This paper presents an empirical study that investigates the performance of developers reflecting on the execution semantics of model-to-model and model-to-text transformations. We measured the accuracy and efficiency of 25 developers completing a variety of traceability-driven tasks in 2 model-based code generators. We compared the performance of developers using ChainTracker, a traceability-analysis environment developed by our team, and that of developers using Eclipse Modeling.

We present statistically significant evidence that ChainTracker improves the performance of developers reflecting on the execution semantics of transformation ecosystems. We discuss how developers supported by off-the-shelf development environments are unable to effectively identify dependency relationships in non-trivial model-transformation chains.

Authors: Victor Guana and Eleni Stroulia
Source: V.G. – RSS

Researcher or Clinician- The tensions and triumphs

Researcher or Clinician- The tensions and triumphs
Being a researcher and an occupational therapy clinician means I have to be reflexive all the time. I am currently part of a research project called Digital Storytelling and Dementia, and I am enjoying the process of meeting participants, hearing their stories and working together to create digital stories. I met with a participant this morning who asked me, a little unexpectedly, “So why are you doing this?” I paused for a moment. I wasn’t sure if he was asking me why I was meeting with him specifically, or why I was doing this research. I smiled and said that I could see the potential benefits of digital storytelling for people with dementia and I wanted to understand better and hopefully use this knowledge to improve lives. He did clarify his question by saying, “I know what I am getting out of this, but I guess I just don’t see what you get out of it!”
As a clinician, I look at the therapeutic value of research,- not as the purpose, but rather as a potential side benefit. I meet with participants and interact with them as I would clients in a clinical setting. In occupational therapy, there is an emphasis on the therapeutic relationship. In research, there is also a relationship that forms between the participant and the researcher. Although some researchers would not consider this relationship as part of the research, I am unable to make this separation.
As a researcher, I would say that I am a narrative inquirer because I think that research happens in relationships, and that these relationships develop through stories. Stories are shared between individuals based on past experiences, but their interactions also become stories themselves. The experiential knowledge that comes from stories contribute to our understanding of others and the world around us.
The digital stories created by people with dementia are powerful and provocative. The use of media enhances the experience of hearing and seeing the story unfold. Yet, for me, the meaning comes from the process that we went through when creating this story. Having conversations, laughing, talking about the past and present, helped us form a bond that the story grew out of. The gentleman I met today knew me by name- even though he has short term memory loss and has difficulty remembering people since he was diagnosed with dementia. I was touched when he opened the door and said my name. Thinking about the time we have shared and the relationship that has formed, I am confident that it is therapeutic. I can be a researcher and a clinician… who knew?

Source: Elly_Park_Research – RSS

Digital Storytelling and Dementia

Digital Storytelling and Dementia

Digital storytelling uses media technology including photos, sound, music, and videos to create a story that can be preserved and shared with others. Past research has found benefits of storytelling for people with dementia including enhanced relationships and communication. The purpose of this research is to explore and understand digital storytelling as experienced by the storytellers – people with dementia. Using a case study design, the study was conducted in Edmonton and Vancouver and is being conducted in Toronto. The study included an 8-session workshop, where eight participants at each site created digital stories with the help of researchers and care-partners. Participants then discussed the experience of sharing and using digital media to create digital stories. Lastly, there was an opportunity to share their stories with loved ones and the public. In this study, audio-recorded interview transcripts and field notes are analyzed using NVivo 11 software. 

For more information, please stay tuned. I will be writing another blog with findings in the coming months!

Source: Elly_Park_Research – RSS

Who I am and what I do

Who I am and what I do

Short biography

I am an occupational therapist (University Universidad National de Colombia) with a MSc degree in Biomedical Sciences (University de los Andes, Colombia) and a PhD in Rehabilitation Science (University of Alberta in Canada). Currently I am doing a PDF on a project at the network Age-well at the University of Alberta. I am also an adjunct associate professor at the University of Alberta, Canada. My research interests are focused on how assistive technologies allow people with disabilities to increase their levels of functioning, capacity and participation.

Researchgate

My research interests

My research project is addressing the research question: What technology-based systems and services should be used to meet older adults and caregivers needs? The project is focused helping older adults to maintain and improve cognitive level through serious games and digital story telling. I am also interesting on investigating the impact of these technologies on social the social engagement, communication and cognitive skills and quality of life of older adults and their caregivers.

I am interesting also in finding clinical evidence about how technologies for preventing falls and wandering improve functional outcomes.

Who I am willing to collaborate with

As an occupational therapist, my boundaries are the evaluation and intervention on occupational performance in order to improve functional outcomes and social participation in elderly. The current project push me to understand the reasoning of other areas such as computer science, engineering, social sciences, behavioral sciences, and management. My research group already have strong interdisciplinary team work between computer science, engineering and rehabilitation medicine. I am interested in learning about the development of serious games for people with dementia and healthy elders.

Source: AdriAgeWell – RSS

Use it or lose it? This is the question 

There are thousands of mobile apps available through online app markets that claim to help people enhance their mental and physical health. They can be widely used for many purposes. You may use them to monitor your health measures (such as blood sugar levels, heart rate, and blood pressure), track behavior and activities, or use apps that suggest you a healthy daily diet. The number of these health related apps are increasing so rapidly that it is almost impossible to keep a track of them. Their use are becoming more and more popular among all age groups. The problem is, despite their popularity and abundance, health mobile apps are poorly regulated and not much is known about their quality and effectiveness. As a matter of fact, there are not any standards on the quality of a health related mobile application or what is the best way to identify a good app form a bad one. Most health related apps do not meet the criteria set for medical devices, hence they are not obliged to seek any approvals from Health Canada, which is the regulatory body for drugs and health products in Canada.

Users may easily get confused by the abundance and diversity of health related apps available on the market. Some may ask their family physician or other healthcare professionals to help them choose the right app for their need. Since there are no guidelines for health care providers to rate the quality of mobile apps, they are not able to provide an evidence based recommendation.

In recent years, as a response to the demand for identifying reliable health mobile apps, several websites have started to publish ratings on popular health related apps. Most of them use ratings based on evaluations made by family physicians or other health care professionals. Examples are Practicalapps.ca , or the Addiction and Mental Health Mobile Application Directory 2016. This is a very good start to enable users make an informed decision when it comes to choosing a health related app. However, it is not clear that how these ratings have been provided. Most of these website do not publish the criteria used for their ratings or the process that they have used in order to rate the quality of these apps. Further, with the fast and ever growing number of apps on the market, it is very difficult for the administrators of the websites to keep the information up-to-date.

Our research team at University of Alberta has proposed a different solution. Instead of ratings each and every app available and publishing the results on an online directory, we propose a quality rating scale that enables health care providers evaluate the quality of any health related app themselves. This way, instead of “giving a man a fish and feeding him for the day”, we will “teach him fishing and give him a lifetime career”. Currently our focus is on mental health apps and our population of interest is senior citizens. However, we are planning to expand this project to other health related apps and include other age groups in future. The proposed rating scale can serve as a guiding reference for clinicians to identify apps that are useful and usable for their clients. Further, the scale can be used as a guiding framework for app developers to design better apps that are more usable by different users.

To do this, we will engage stakeholders such as senior citizens, app developers, and clinicians in the process of design and development of the proposed rating scale. The study protocol has been approved by the University of Alberta Research Ethics Board and we are ready to start recruiting participants for the study. If you are interested to learn more about this study feel free to contact me at azadkhan@ualberta.ca. Perhaps you can sit at one of the stakeholder committees and provide us input on items that you believe should be on a scale to rate the quality of health related apps.
Source: Peyman Azad Research Blog – RSS

Paul Lopushinsky Podcast Interview

I had a great time visiting Paul Lopushinsky in his podcast. We talked about bringing programming to people, why the relationship with a PhD supervisor needs to be like a good marriage, some internship stories, video games, and more. The interview had a very laid back spirit with tons of funny moments. Podcasts with Paul is available in iTunes here.

https://www.stitcher.com/podcast/podcastswithpaul/podcasts-with-paul/e/pwp-003-victor-guana-43058443

Source: V.G. – RSS

Introducing ScreenFlow: Mobile Storyboards in a Nutshell

In the early stages of a mobile application’s design, storyboards give developers a way of visualizing its navigation flow and interaction patterns. Furthermore, storyboards highlight triggers such as buttons and menus that make an application transition between different screen-states. Modern mobile development platforms such as Android, iOS, and PhoneGap impose a Model-View-Controller architecture to their applications. These platforms usually encapsulate in XML files the application’s layout and event handlers, while the application’s dynamic behaviors are encapsulated in source code files, written in languages such as Java or Swift. More often than not, initializing and synchronizing the diverse development artifacts in a mobile application is a challenging and error prone task. 

In collaboration with Kelsey Gaboriau, I developed ScreenFlow, an Eclipse plugin that enables developers to quickly translate their storyboard sketches into application skeletons ready to be further enhanced. We believe that ScreenFlow is particularly useful for novice application developers or for rapid prototyping environments such as hackathons. The ScreenFlow language is divided into four main sections that allow developers to define the different elements of a storyboard, namely, the application screens, the application graphical triggers, the application transitions, and the application hardware permissions. Below you can find a video that showcases the plugin. This plugin has been built as a code-generation environment using ATL, Acceleo, and XText. (more information, and download site, to come)

Source: V.G. – RSS

Identifying Iron Depositions in Histological Samples: A Basic Image Processing Exercise

A couple of months ago Erika Johnson a Neuroscience Master’s student at the University of Alberta shared with me an interesting problem she’s been facing while conducting series of analysis in histological samples of brain tissue. The problem was an interesting yet simple challenge in the general field of image analysis. Before jumping into the specifics of the problem, Erika explained to me the core of her research.

In Erika’s words –multiple sclerosis is a crippling autoimmune disease of the brain and spinal cord in which the brain to attack itself. This leads to severe disabilities in movement, sensation, and even cognition.– she also explained that –when the brain attacks itself it creates a lesion, which is an area in which the cells are injured and inflammation is prevalent.– Erika also shared something that was quite surprising –you see, the cause of these lesions remains relatively unknown. However, abnormally high iron load has been observed in brains with multiple sclerosis, and that is something I’m investigating in my thesis–

I asked her if iron wasn’t a normal substance in the brain, to what she commented –well yeah, while iron is required for the healthy brain to function, when concentrations exceed a certain point it can cause inflammation and even become toxic to the brain cells.”

Erika explained that scientists do not yet understand where this excess iron comes from, and that being able to study how much extra iron is found in the brains of those with multiple sclerosis, is an important step to understanding more about this disease.

So what is the problem Erika was facing? Erika explained that –an example of determining iron concentrations and its cellular locations can be carried out through the use of a histological protocol that, through a set of chemical reactions, highlights in blue the presence of iron in samples human tissue. This protocol is called the Perl’s Prussian protocol.– You can see a couple of samples below:

However, being able to quantify the presence of staining in the microscopy images that she obtains after conducting the protocol is extremely hard. Even more considering that she was dealing with hundreds of images from different samples. Basically, Erika needed to figure out the percentage of certain “shades of blue” in each one of her microscopy images. We joined forces and solved the problem in a long weekend of coding extravaganza!

The goal of this post is to briefly lay down the strategy that we use in order to solve the problem using a basic image processing technique.
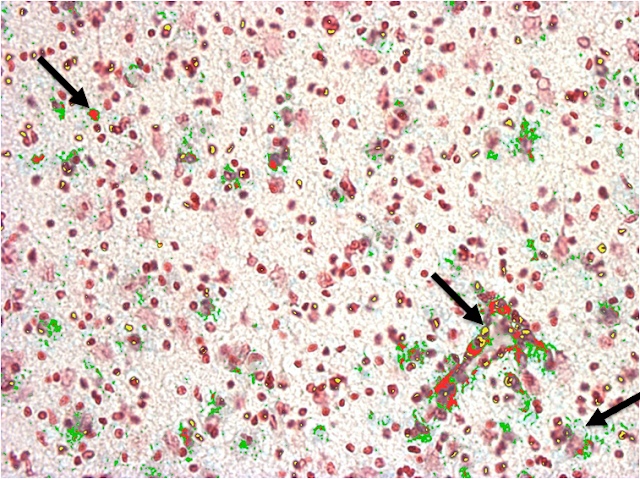
1. We took a representative set of images from the to be analyzed samples, including corner cases where features of interest were barely present, or predominantly exposed. Erika was interested in several features of the images, including fading iron depositions, depositions that overlapped cells, and areas with highly dense staining (see arrows below). We then identified instances of the features of interest to be studied viz. to be isolated and measured.
2. Once features were selected, we identified the predominant color for each one of them. Concretely, for each set of features we manually examined their corresponding pixel colors by slicing their areas in polygon slices of 10 to 50 pixels depending on the size of the feature. We executed this process in all of the images in the set of representative images selected in Step 1. As a result we selected up to four predominant colors for each feature of interest. We called this set of colors the normative colors of each feature.

3. The analysis engine that I developed takes as input the images to be analyzed, along with the RGB values of the normative colors of each feature to be studied. In short the analysis engine analyses all the pixels of each image under study in order to identify and measure the areas where the normative colors are located, thus identifying and measuring the features of interest. The resulting process can be observed below. The color of each feature highlighter can be set up in the code.

In order to make the analysis engine more precise, the engine also receives as input two numbers that define the upper and a lower shade thresholds for each normative color assigned to a feature. This is, given that each feature may include multiple normative colors, and that each color may be found with different shade intensities in a feature, the shade thresholds help the engine to more precisely pinpoint the pixels corresponding to a feature regardless of the shade intensities of the normative colors present in its area.

Our experimental results revealed that using fine-tuned shade thresholds significantly improves the precision of the engine when identifying and measuring features. Furthermore, our implementation has a negligible feature intersection value. This is, in our empirical validation the total percentage of pixels that were assigned to more than one feature was 0.0069% on average across all the analyzed pictures.

4. Finally, once the areas of the features have been identified and measured in terms of their number of pixels, information such as the corresponding percentage our of the total picture size, and relations between feature sizes can be exported in plain textual files for further analysis. The reporting of the measurements was also a very interesting challenge to solve given how pathologist label and store the images of a sample and how each sample is split in multiple images. I’ll be sharing a a post on this matter soon!

The code is open source and it is available in github: https://github.com/guana/coloranalysis

Source: V.G. – RSS